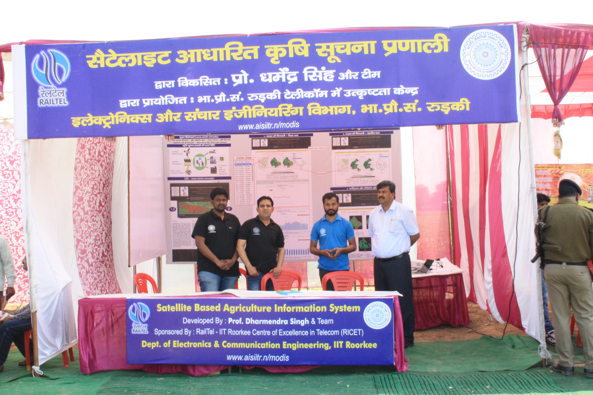
Satellite Based Agriculture Information System (SBAIS)
India's agriculture is statistically the widest economic sector, which forms the basis of largest employment source and a major section of the overall social expansion.
For high agricultural productivity the agriculture practices need to be implemented which could be only performed by proper agriculture/crop monitoring.
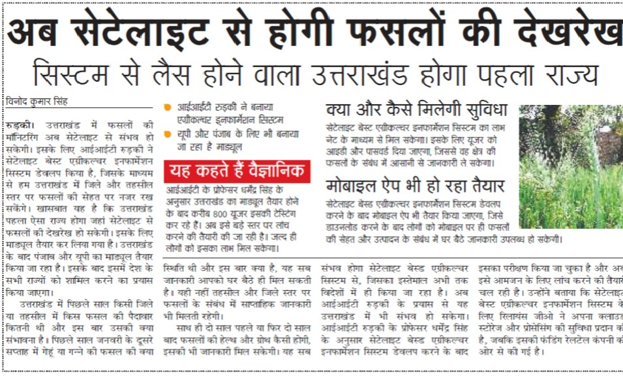
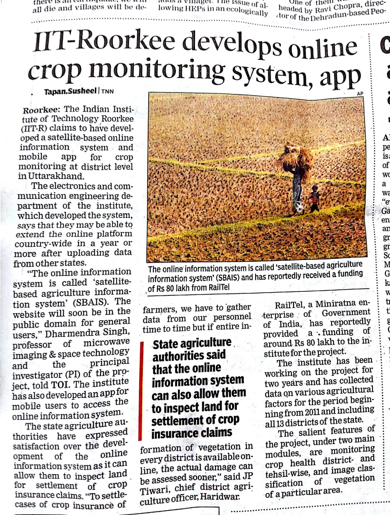
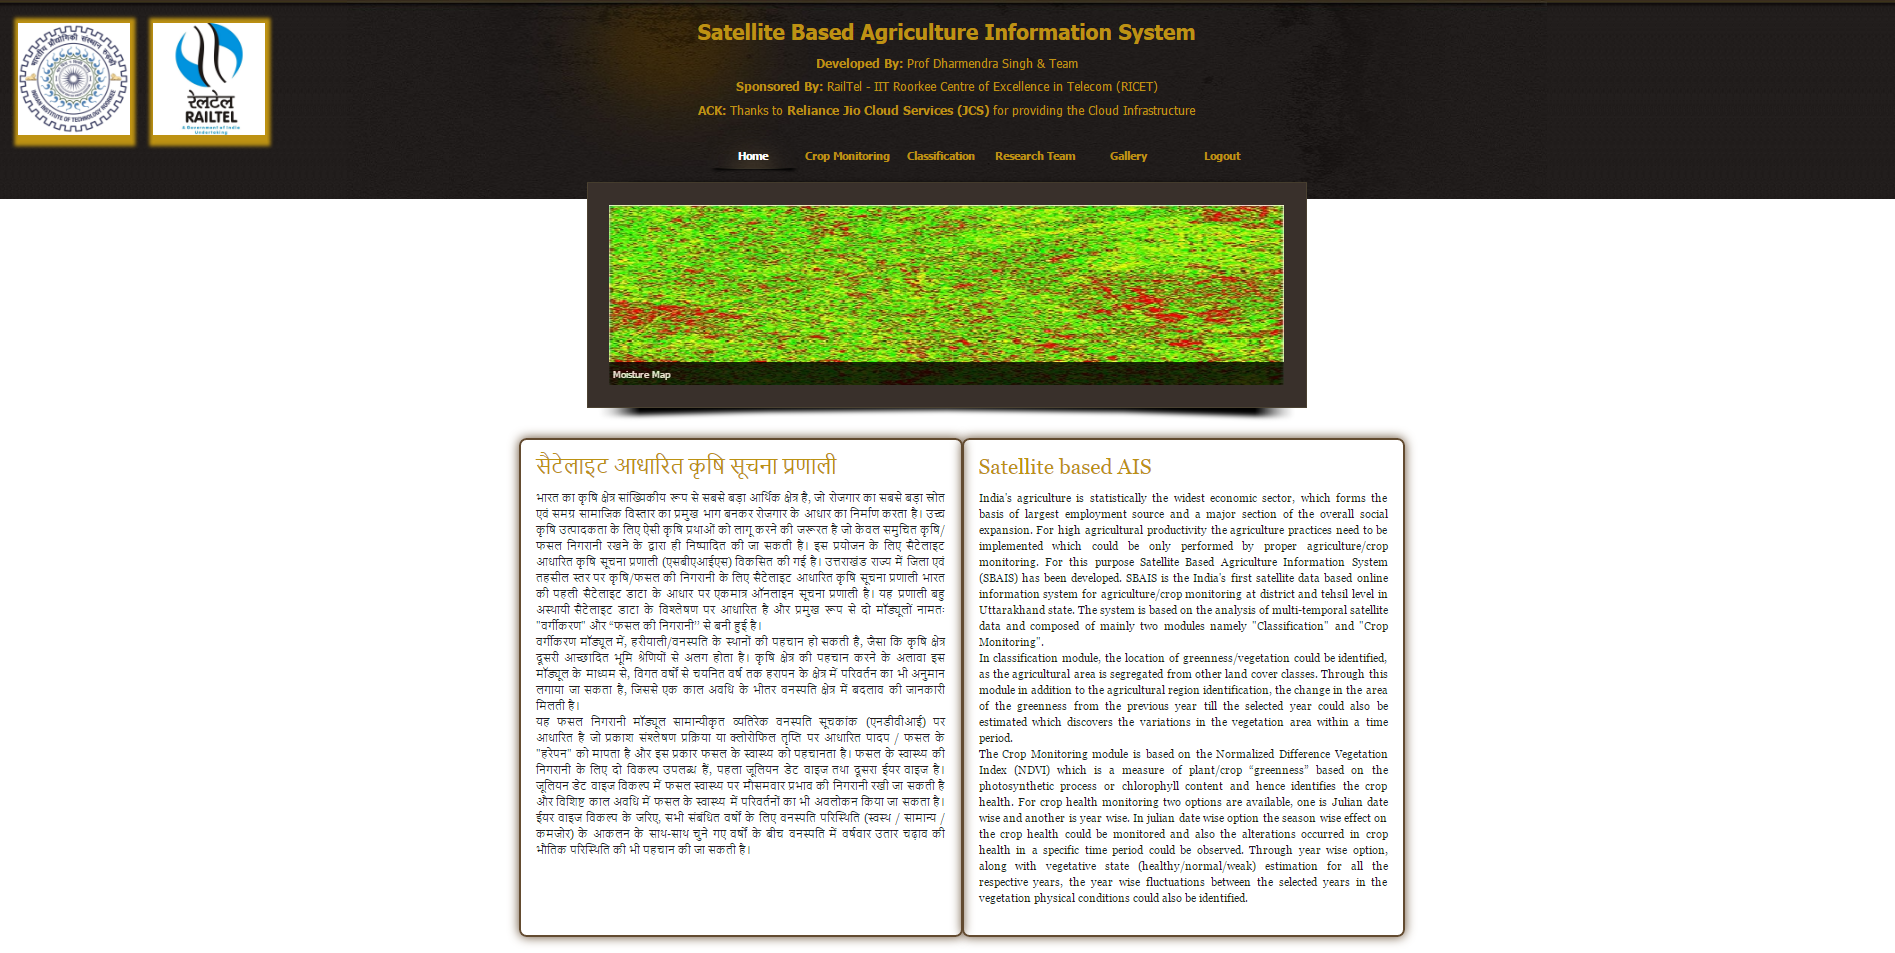
For this purpose Satellite Based Agriculture Information System (SBAIS) has been developed.
SBAIS is the India's first satellite data based online information system for agriculture/crop monitoring at district and tehsil level, Drought Monitoring at state level.
The system is based on the analysis of multi-temporal satellite data and composed of three modules namely "Crop Monitoring", "Classification" and "Drought".
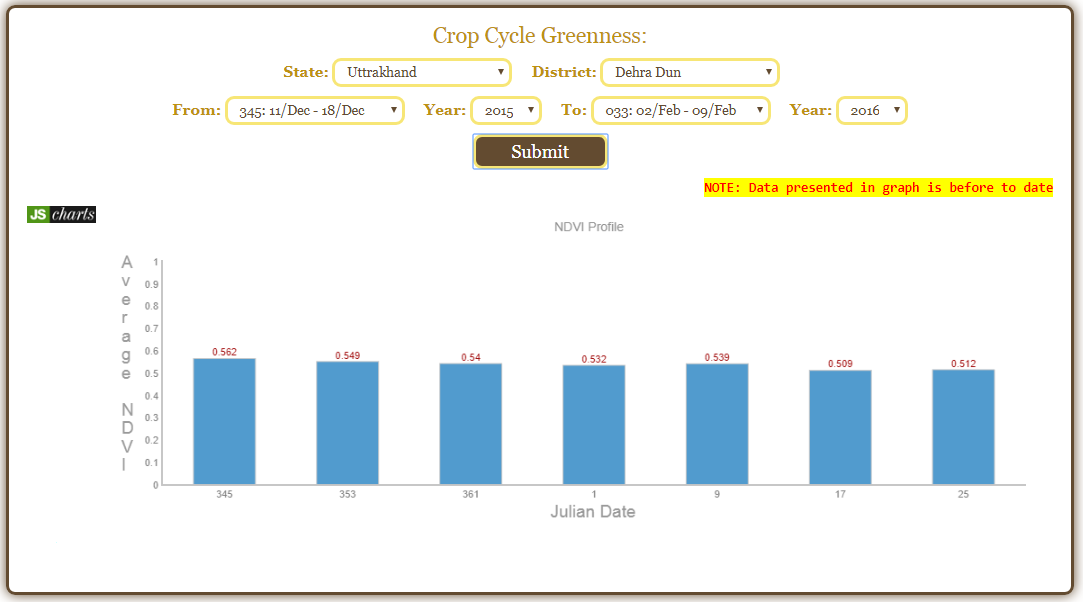
The Crop Monitoring module is based on the Normalized Difference Vegetation Index (NDVI) which is a measure of plant/crop “greenness” based on the photosynthetic process or chlorophyll content and hence identifies the crop health. For crop health monitoring three options are available, Julian date wise, Year wise, Crop Cycle. In julian date wise, the season wise effect on the crop health could be monitored and also the alterations occurred in crop health in a specific time period could be observed. In year wise, along with vegetative state (healthy/normal/weak) estimation for all the respective years, the year wise fluctuations between the selected years in the vegetation physical conditions could also be identified. In Crop Cycle, user can select a particular span to monitor vegetation index.
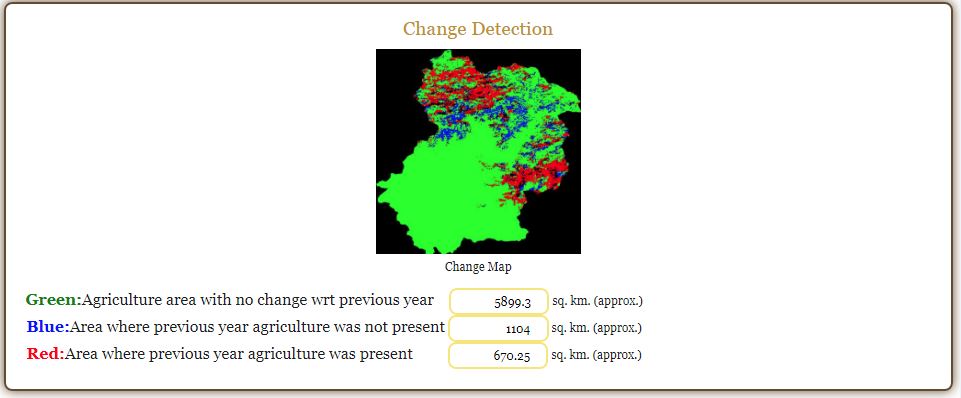
In classification module, the location of greenness/vegetation could be identified, as the agricultural area is segregated from other land cover classes. In addition to the agricultural region identification, the change in the area (positive change, negative change and no change) of the greenness from the previous year until the selected year could also be estimated which discovers the variations in the vegetation area within a time period.
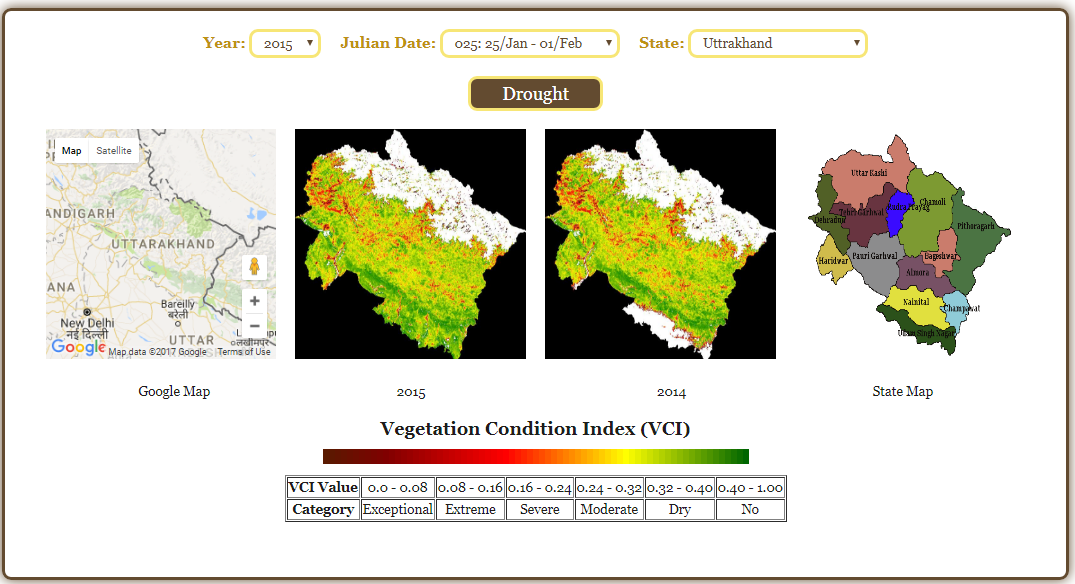
In Drought module, we can monitor the level of drought with Vegetation Condition Index (VCI) in different regions of the states. This module opens for only Uttarakhand state.
The Crop Monitoring module is based on the Normalized Difference Vegetation Index (NDVI) which is a measure of plant/crop “greenness” based on the photosynthetic process or chlorophyll content and hence identifies the crop health. For crop health monitoring three options are available, Julian date wise, Year wise, Crop Cycle. In julian date wise, the season wise effect on the crop health could be monitored and also the alterations occurred in crop health in a specific time period could be observed. In year wise, along with vegetative state (healthy/normal/weak) estimation for all the respective years, the year wise fluctuations between the selected years in the vegetation physical conditions could also be identified. In Crop Cycle, user can select a particular span to monitor vegetation index.
In classification module, the location of greenness/vegetation could be identified, as the agricultural area is segregated from other land cover classes. In addition to the agricultural region identification, the change in the area (positive change, negative change and no change) of the greenness from the previous year until the selected year could also be estimated which discovers the variations in the vegetation area within a time period.
In Drought module, we can monitor the level of drought with Vegetation Condition Index (VCI) in different regions of the states. This module opens for only Uttarakhand state.
- To develop agriculture information system with satellite data as input
- To retrieve real-time information of crops like health,moisture content, disease etc. at district and tehsil level
- To provide information to end user through cloud service and to make them cost effective and hassle free
- To develop web based and SMS based service
- Land Cover Monitoring
- Change Detection
- Crop Health/Agriculture Monitoring
- Soil Moisture Monitoring
- Real Time Assessment for Decision Making
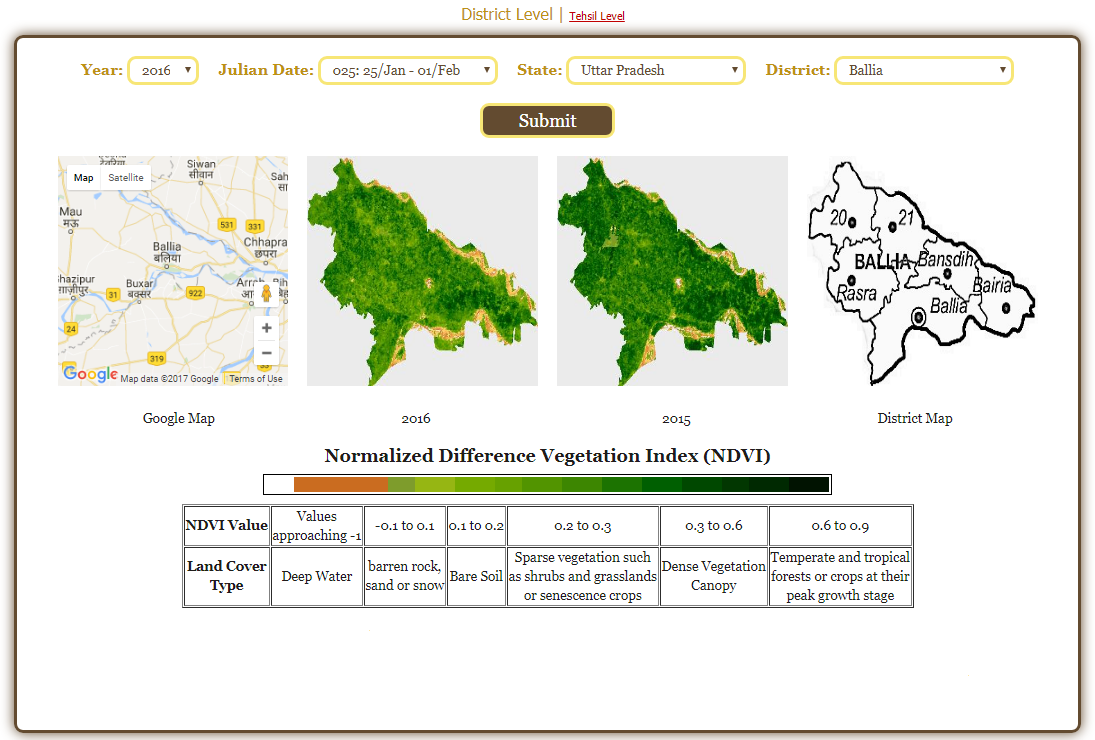
In this module there are few sub features based on normalized difference vegetation index (NDVI). NDVI is computed from the reflections obtained from wavelengths of red and near infrared portion of the spectrum. Due to photosynthetic activity that occurs in plant, it absorbs most of the visible portion of the spectrum but reflects about 40% in near IR spectrum. The computed NDVI can take a value between -1 to +1, and plants usually have positive values of NDVI. Higher the value of NDVI indicates, denser the plants or healthier the plants are. All the sub modules are developed for district wise and tehsil wise monitoring.
- Normalized Difference Vegetation Index (NDVI) Map
-
-
-
-
NDVI map is generated by computing NDVI for the selected data and region and then applying color map depending on the obtained values. This helps user to get an idea of change is scenario of vegetation for their selected location. Along with the map, a color bar is also given along with the description of the color, which it represents.
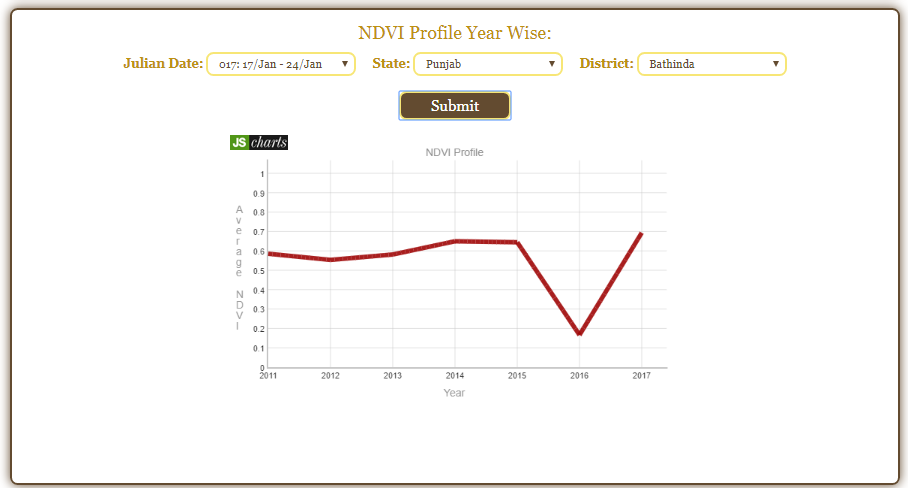
NDVI profile is generated by plotting average NDVI values of the selected region over time period. Average NDVI values of different locations are pre computed and stored, which is then later used to generated NDVI profile. For a selected location the NDVI profile can be viewed in three different time scales such as year wise, Julian date wise and cyclic profile. This information helps user to gain knowledge about vegetation trends for different periods and to identify crop cycles in a particular region.
This module portrays a district wise indication of the average NDVI profile for a specific time period for a particular year. It enables to identify the season wise oscillations in the vegetation health and also allows the monitoring of the alterations occurred in a specific time period.
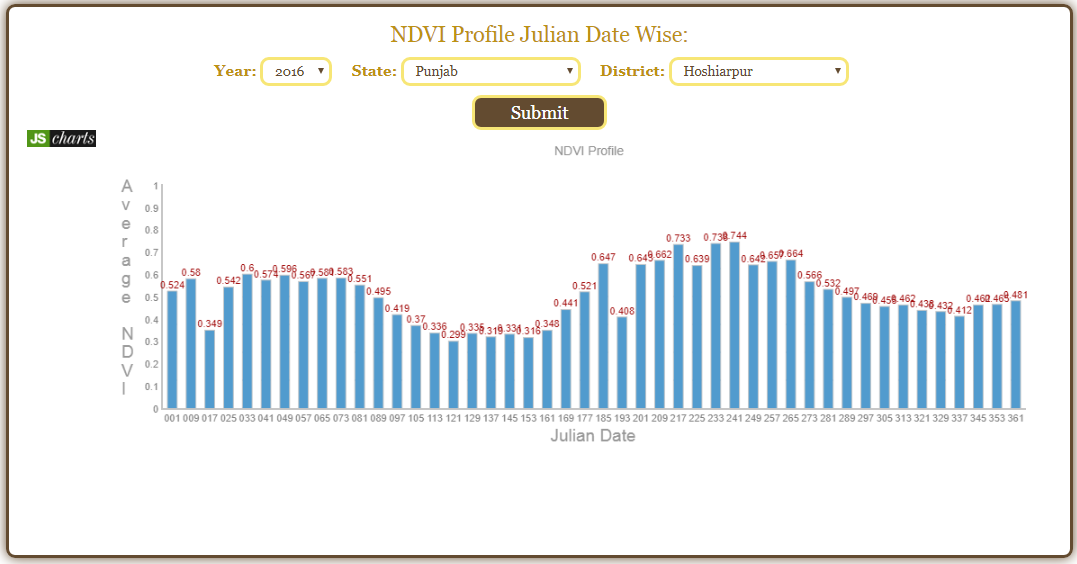
This module portrays a district wise indication of the average NDVI profile for a specific time period for a particular year. It enables to identify the season wise oscillations in the vegetation health and also allows the monitoring of the alterations occurred in a specific time period.
Classification and Change Detection:
A knowledge based decision tree classifier is used to classify the satellite data. Since we are interested only with vegetation, other classes are grouped into one class and is represented with red, while vegetation is represented with green. Similar to the NDVI map, classified map of selected region is displayed for the selected date and the same date of previous year.

In this module, change detection algorithm is implemented to identify the changes in vegetation. Both positive and negative changes in vegetation is identified from the two classified images of the consecutive years. The change map of any selected district with green color showing no change in vegetation, blue showing positive change and red showing negative change.
In this module, we can monitor the level of drought with Vegetation Condition Index (VCI) in different regions of the states. This module opens for only Uttarakhand state.